
Powerful geo-visualization extension for QlikView and Sense
NPGeoMap discovers correlations in your data which cannot be seen with tables and graphics alone. NPGeoMap also covers complex requirements for geoanalysis, sales territory controlling, location search, route visualization, etc. NPGeoMap creates your first map object in QlikView and Qlik Sense within seconds with only three mouse clicks. Many dynamically customizable functions allow you to customize for any business area or analysis requirement.
NPGeoMap is able to display areas analytically even without an internet connection using the supplied area maps. Well-known map providers such as Google Maps, Open Street Maps, MapBox, Here, ESRI Server, WMS and WMTS/Tile Server can be used as background maps in conjunction with NPGeoMap objects.
NPGeoMap offers 1-click installation, is easy to configure and integrates perfectly into your Qlik environment (Local Client, Qlik Server). Maps of the most important countries are included, no additional server installation necessary, own maps for sales areas, etc. can be created with the additional tool MapMaker. NPGeoMap can be used in all regions of the world!
Due to its intelligent architecture NPGeoMap is performant even with large amounts of data and can display your data in any number of layers as areas, points, lines, heat maps, cluster points, hexagonal grids, charts, popups, tooltips, isochrone, etc.
Use NPGeoMap for the following tasks:
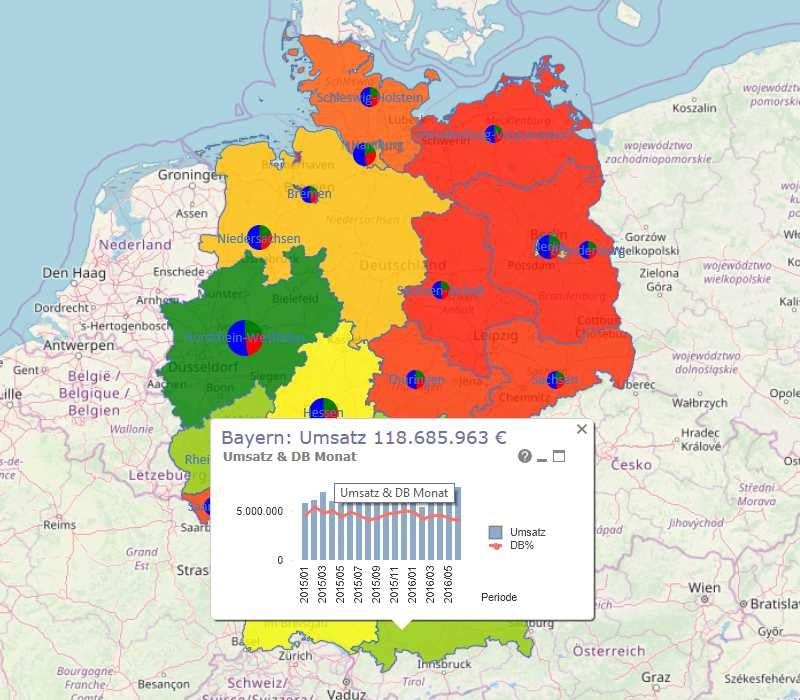 Sales territories: Display sales development, area analyses, key figures in so-called pop-ups; integrated chart engine to display company data (product groups, etc.) area-related, display additional information in pop-ups and tooltips.
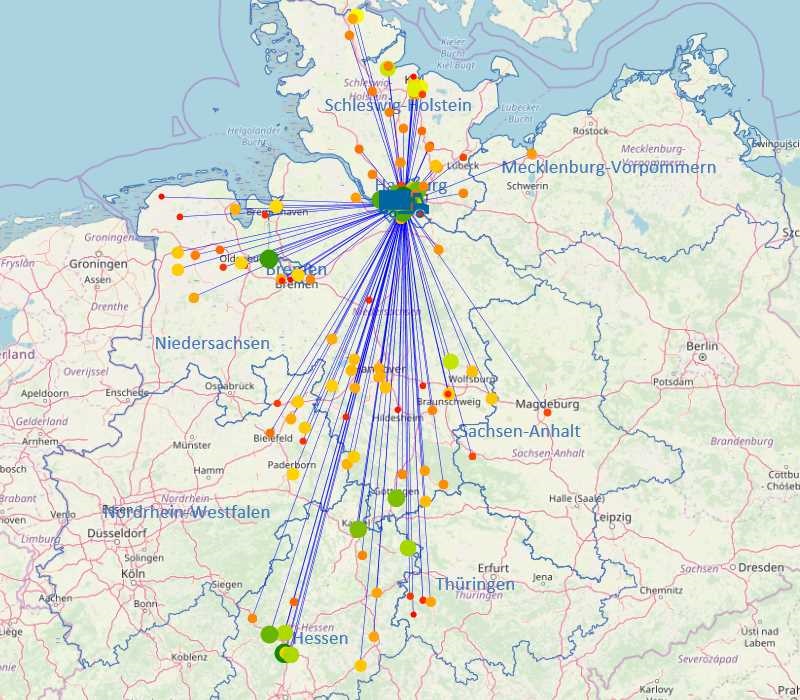 Relationships: using lines and routes to represent relationships (flow of goods, customer -> vendor, etc.). Questions such as: which store is supplied from which warehouse, can also be displayed visually.
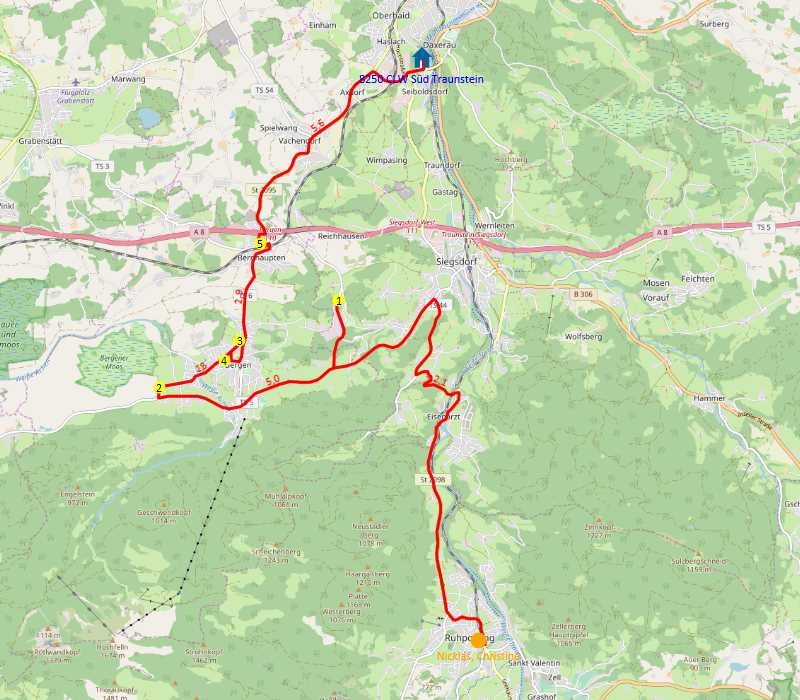 Travel distances and routes: either display routes with given coordinates or calculate travel distances according to distance, travel time, optimal route. Consideration of traffic, choice of means of transport, etc.
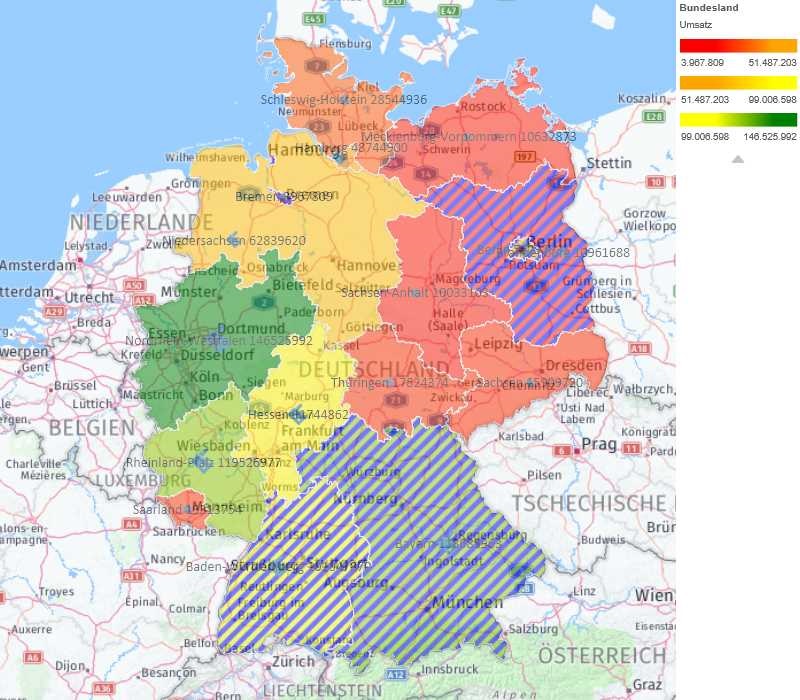 KPI's: many visualization elements can display different key figures in one object. Using colors, transparency, border lines, patterns, labels, pop-ups, tooltips, etc., key figures can be displayed in a highly flexible manner.
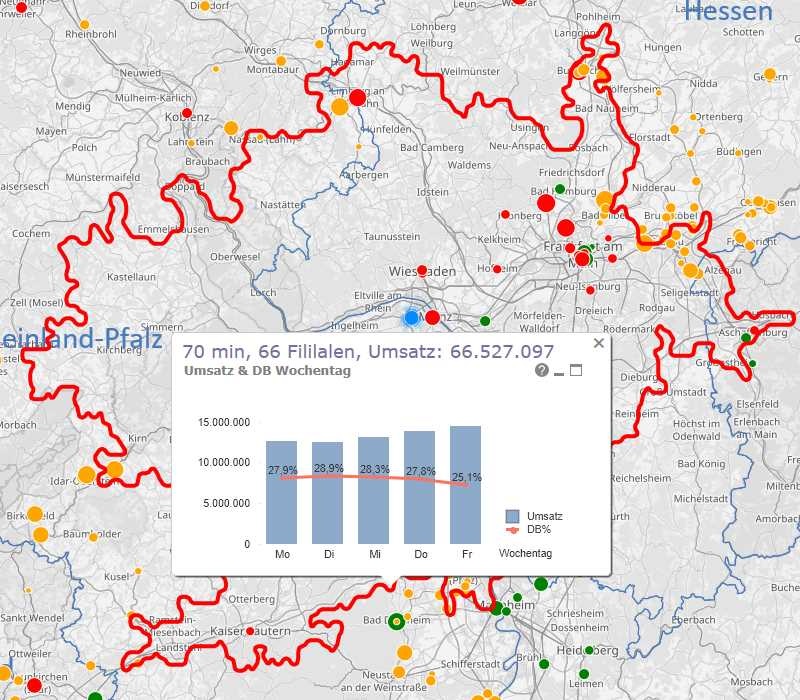 Radius analysis: which customers are within X minutes by car, walking minutes, road kilometres, linear distance from any starting point. Important for location and store planning, visit planning, sales optimization. KPI's of customers, stores, etc. located within the radius can be displayed in pop-ups.
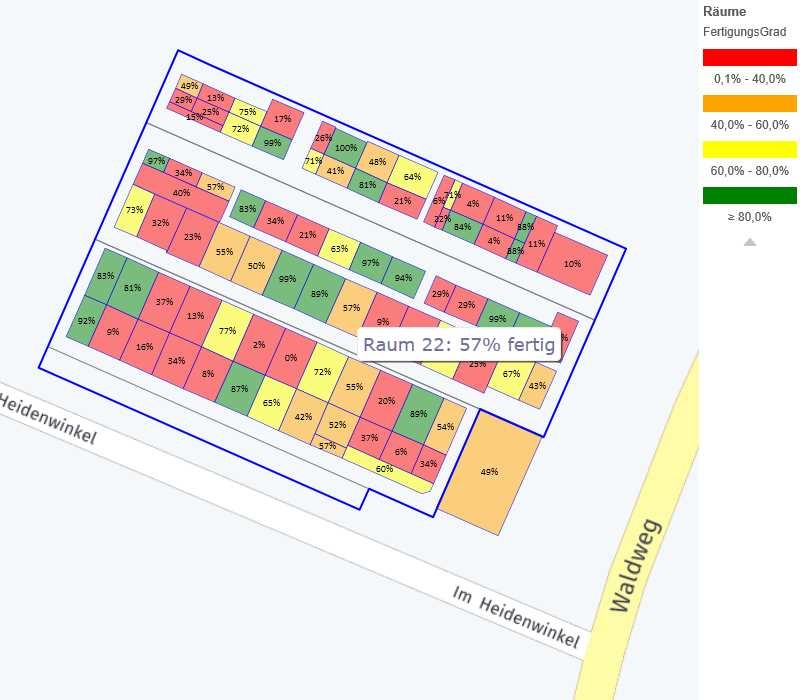 Buildings: building sections, production facilities, production status per work area, key figures in relation to the areas displayed, ... Many possibilities to convert objects drawn in CAD programs into NPGeoMap objects and use them for geographical analyses.
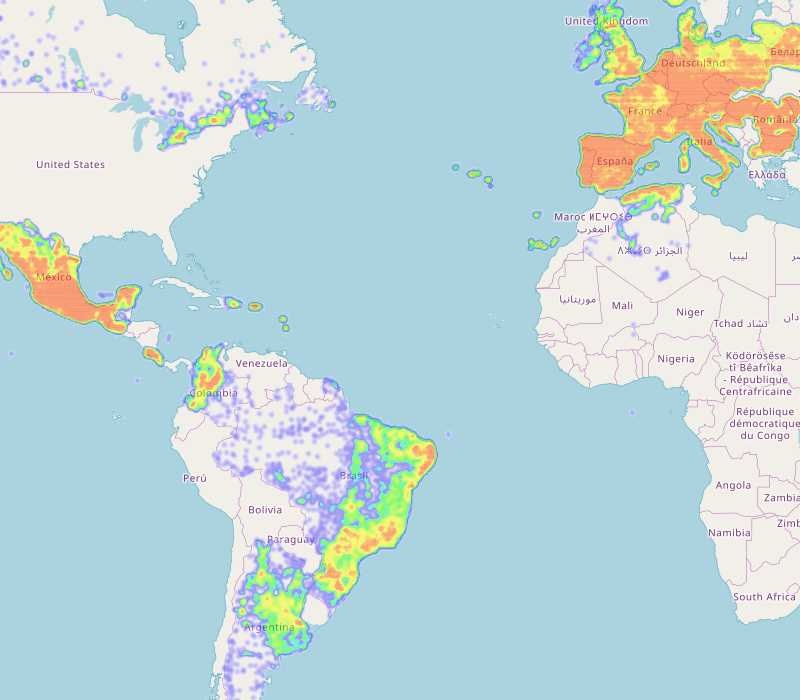 Heatmap: to display frequencies, focal points, customer density, intensity, etc.
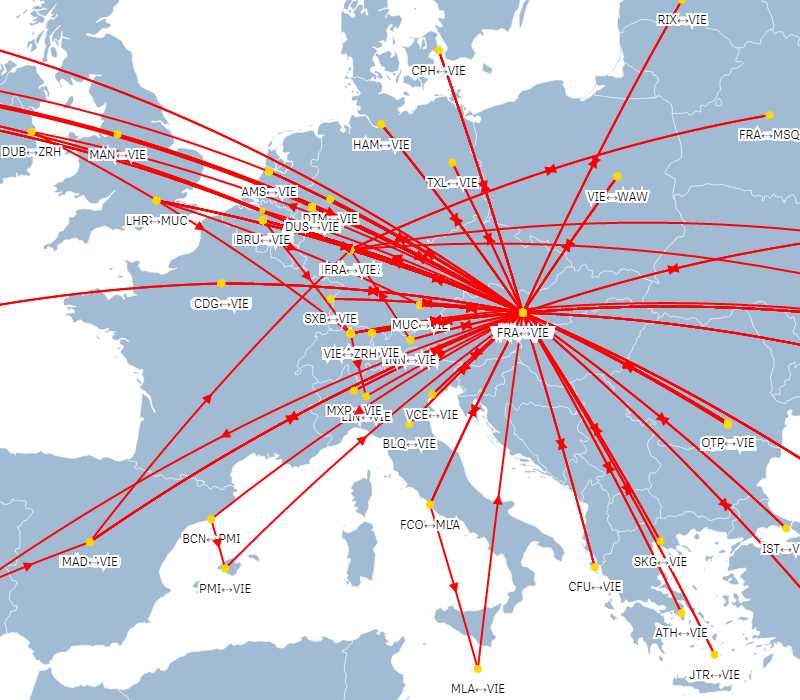 Flight routes: visualize flight routes according to the curvature of the earth with great circles, arrows shown on the lines indicate the direction. KPI's can be visualized by tooltips and popup's.
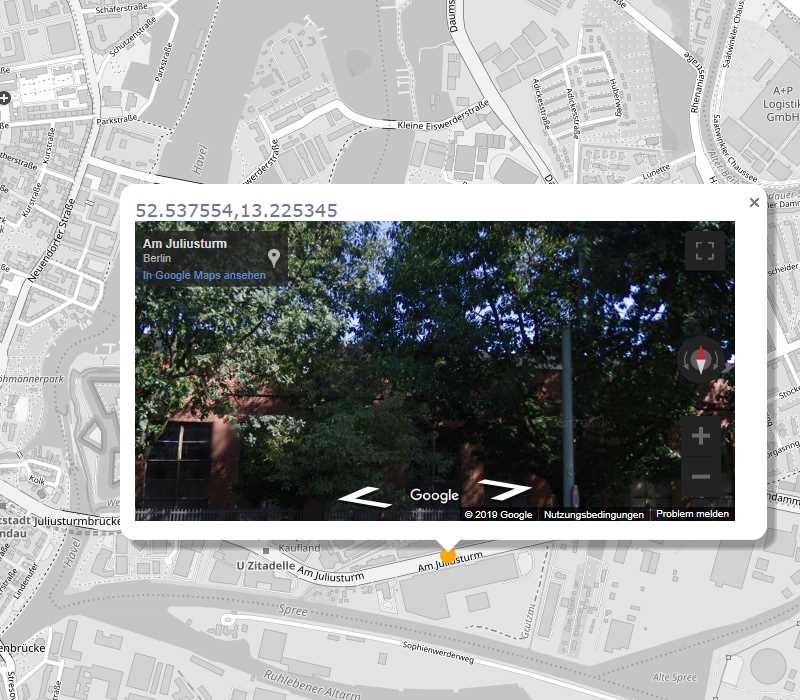 StreetView: HTML can be used in many elements, e.g. to display Google Street View in popup's when clicking on a certain point. Links to zoning plans, traffic information, weather data, etc. are further possible uses.
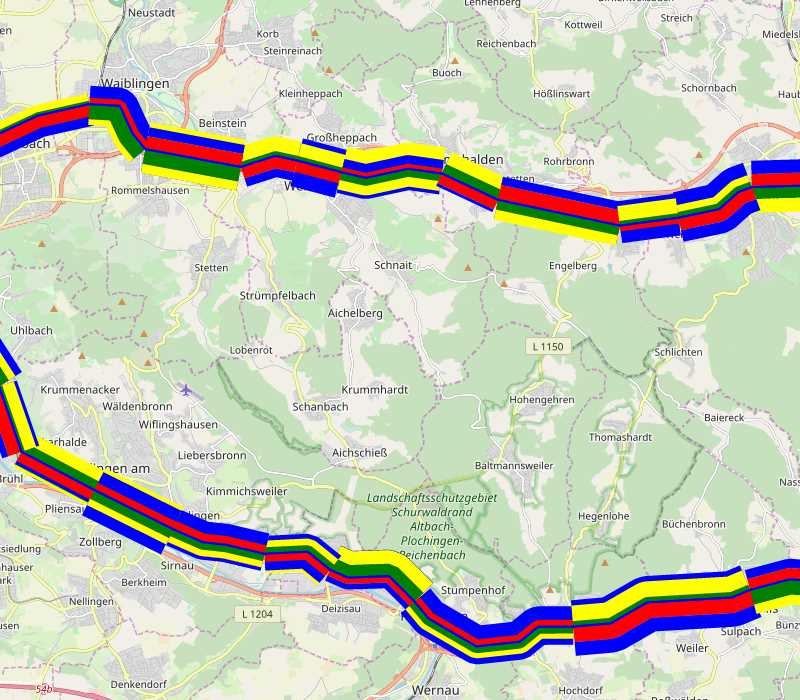 Stacked Bars: Enable the display of several key figures (passengers, tonnage, delay, ...) on route sections.
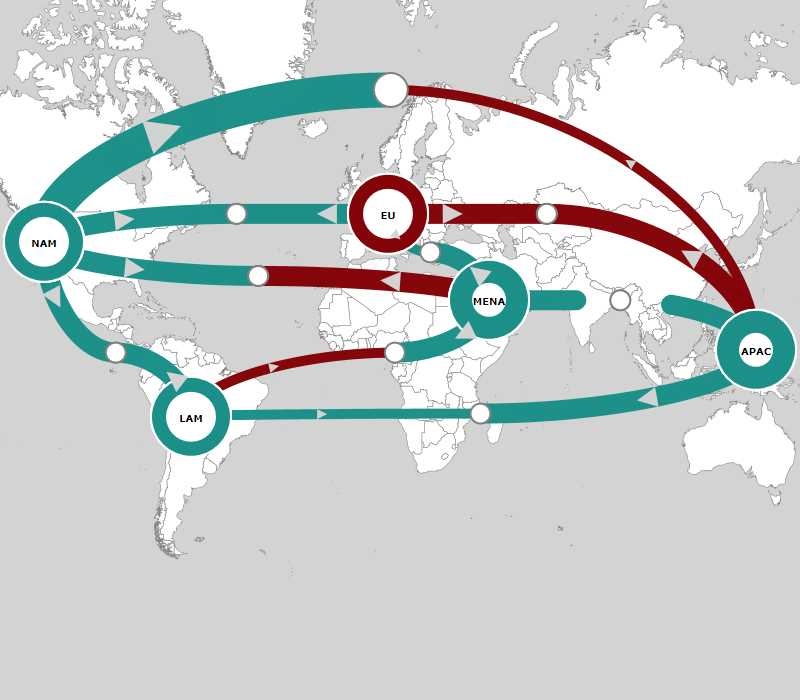 Animated lines: Display relations, route progressions and movements.
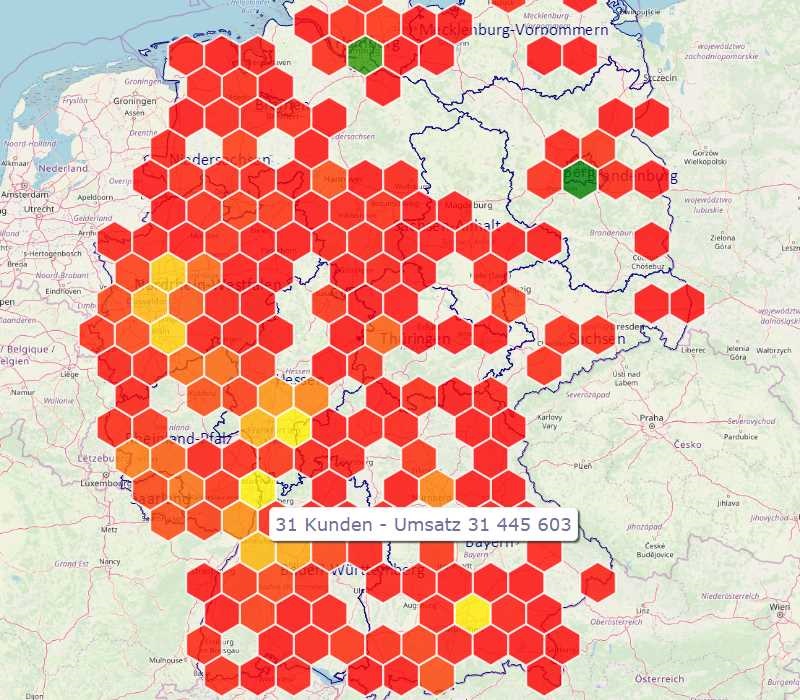 Hexagon-Cluster: Aggregation of individual points according to freely definable spatial criteria in order to obtain a quick overview of market penetration, frequencies, focal points